

I am going to cut straight to the chase…day trading stocks is a pipe dream that only a few investors can ever hope to accomplish. In essence day trading is a trap for the average retail investor.
There are only 5 reasons that day traders constantly fail.
- Failing to look at liquidity
- Failing to look at stock statistics
- Relying to much on chart drawings and trend lines
- Failing to read reports
- Following other traders advice
However, if you know these 5 reasons you can work to not become an average day trader who ‘donates’ a majority of their money back to the market. If you must day trade, I am going to show you how to not lose money but rather gain returns time and time again. By practicing not performing the pitfalls of every other day trader you will end up making money.
As always if you like content like this then feel free to subscribe to the free newsletter. I put out stock research and tips/tricks of the trade to help you consistently generate wealth in the markets.
Without wasting any more time, let’s jump right into the 5 main reasons day traders constantly fail.

Reason 1: Failing to Look at Liquidity
Ahh, stock liquidity. Without it your investment/trade is absolutely worthless.
Liquidity is simply the ability for you to turn your shares back into cash, or to ‘liquidate’ your position. A simple way to gauge liquidity as a retail trader is to simply look for the average daily volume on a stock. I typically go by 90 day moving average volume. Yahoo Finance will auto-calculate this for you here, simply enter your stock ticker and navigate to the statistics tab.

The stock statistics for SDC are displayed above. Notice how the 3 month average moving volume is 8.14 million shares. This is the normal 90 day average moving volume on the stock, or the ‘liquidity.’
You might be asking yourself “Ok, I get it. Why does it matter?”
Well the simple answer is this. If you take too large of a position and only expect to hold it for a day then you might encounter liquidity concerns when you try to liquidate your position. This is because you hold way too many shares and when you sell them to the market you will tank the spread and sell them for significantly less than you expect.
If this happens you will lose 20-30% of your investment because of liquidity, or lack thereof. Let me show you an example.
Example of Failed Day Trading Because of Liquidity Concerns
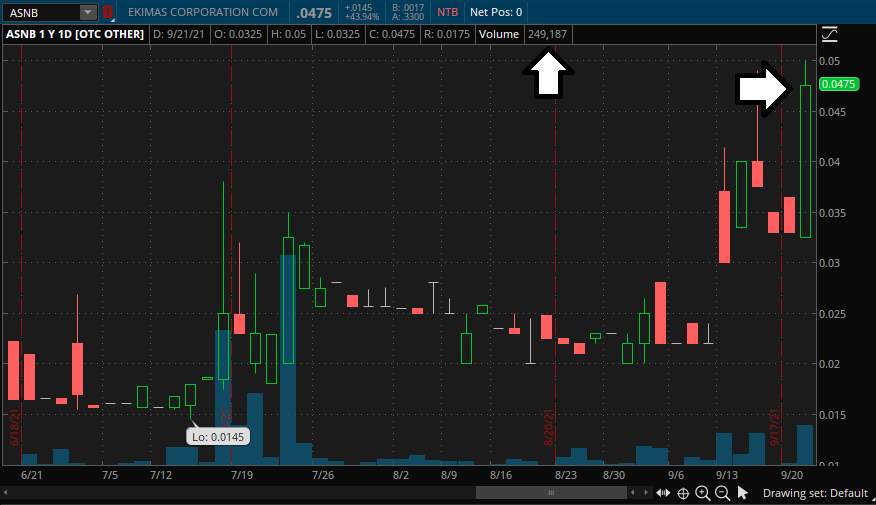
The above image is of the stock ASNB, it is a penny stock and it trades at $0.0475 a share. Notice how the chart had a rapid uptrend on the latest day, a 35% gain intraday. That’s pretty nice and is a good investment right? Wrong.
There is no volume on this stock, thus no liquidity. The average daily volume is around 150,000-250,000 shares daily at a price of $0.047. That means that in total close to $12,000 represented the entire market for that day.
If you bought into this stock thinking you could flip it you could only put in around $100 before encountering liquidity concerns. That is assuming that there were sellers on the stock, and that the spread was decently priced.
A ton of stocks will have manipulated volume to attract retail investors who only see the green percentage sign. They jump into the stock and become ‘bag holders’ when they realize they can’t sell the stocks back to the market. The next step for the unfortunate souls is to pray that volume will increase to the point where they can sell out.
Do not become one of these guys, watch out for liquidity.
Reason 2: Failing to Look at Stock Statistics

Every stock has statistics associated with it. If you want to be a successful day trader you need to look at them.
These are the entry level statistics that day traders always forget to monitor.
- Average daily volume (already touched upon)
- Float
- Short Percentage
Retail day traders absolutely need to know about the float and short percentage of a stock. These stock statistics will allow you to place investments before huge explosions such as the infamous GME short squeeze of January 2021.
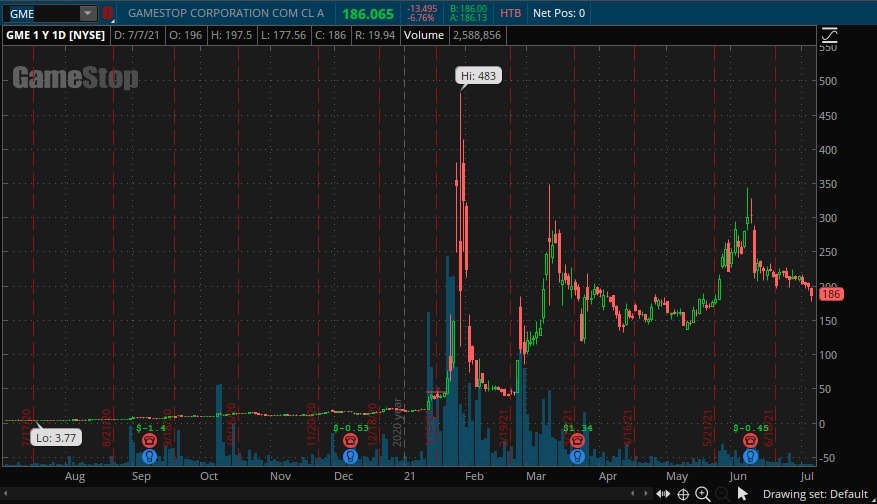
The whole reason that GameStop was able to explode from $45 to a massive $483 within two weeks was because of a combination of increasing volume, high short percentage, and an extremely low float.
In essence it created a perfect scenario for day traders to make huge returns in the range of 10,000% on short term far OTM options.
If you had known of these statistics then and you were watching the market you could have made huge returns. Novice retail day traders need to learn about these statistics to determine how much a stock can grow in a short period of time.
Let me show you these statistics work together.
Float
‘Float’ stands for the amount of public shares that can float between different accounts on the market. If a company has a float of 1 million shares, then there are only 1 million shares available for retail traders to buy or sell on the stock market.
This means that if a company has a float of 20 million and an average daily volume of 100 million then the entirety of that company’s public stock traded hands 5 times during the day.
When you encounter a stock where the float is low (under 100 million) and the average daily volume is near or above the float size then you can safely assume that the law of supply and demand will impact the price. If the price is trending upwards, then retail investors will clamor to enter the stock, which will rapidly increase the price.
You can see this happening long before the price happens. If you monitor a trade this alone can make you a decent return.
I find my stock floats on a stock from Yahoo Finance by going to the statistics tab. (Yahoo Finance)
Short Percentage
When a stock is shorted investors bet that the price will go down. They borrow shares from another party (individual/broker) and immediately sell them. This creates a share deficit in their account that they must zero out by buying back the exact same amount of shares at a future date. The goal of shorting is to buy back shares at a lower price, thus making the price difference.
If that was complicated don’t worry, here is an article I wrote that goes over shorting in depth.
Shorting a Stock Explained: Making Money When the Stock Goes Down.
Short Percentage is simply the amount of shares that are out on loan by percentage of the float. If a stock already has a low float and a then has a high short percentage (20% or more) then it’s at risk of a short squeeze.
Short Squeezes are an amazing way for professional traders to make a huge ROI in a very quick way. If timed properly you can return huge returns in the range of 200%!
To find the short percentage go the statistics tab of a stock on Yahoo Finance. (Yahoo)
Example of Statistics Tab in Yahoo Finance
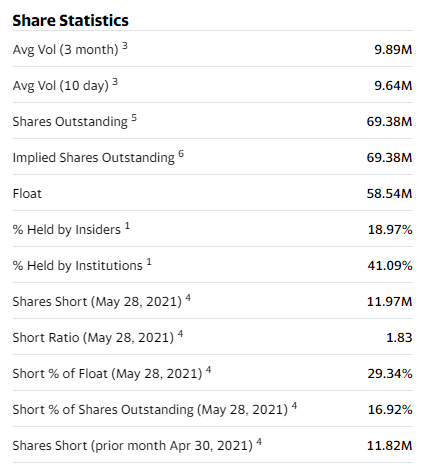
This is the share statistics tab for GME in Yahoo Finance. Notice how the float is only 54 million while the short percentage is 29%. This indicates that GME could move upwards very rapidly, which is a good thing for day traders.
Reason 3: Relying to Much on Chart Drawings and Trend Lines

Retail traders who are just starting out will very quickly learn about chart drawings and trend lines. It seems that everyone is a professional when it comes to technical analysis, which they believe is drawing on charts to predict the future stock price.
Yes, there is some merit to trendlines and charts. One of the best books on the subject is Technical Analysis of the Financial Markets: A Comprehensive Guide to Trading Methods and Applications by John J. Murphy (1999).
However, the real professionals only use trendlines and chart patterns to place entrance and exit points on stocks. This is because all retail traders nowadays follow and trade off trend lines and if you know how a majority of people trade you can make money by getting in and out slightly before them.
For example, if I think that a stock will exhibit a price pattern in the near future I will place a trade to get in and out long before the chart exhibits the pattern. I just use the volatility generated by retail traders to get the best exit price possible. Let me show you what I’m talking about.
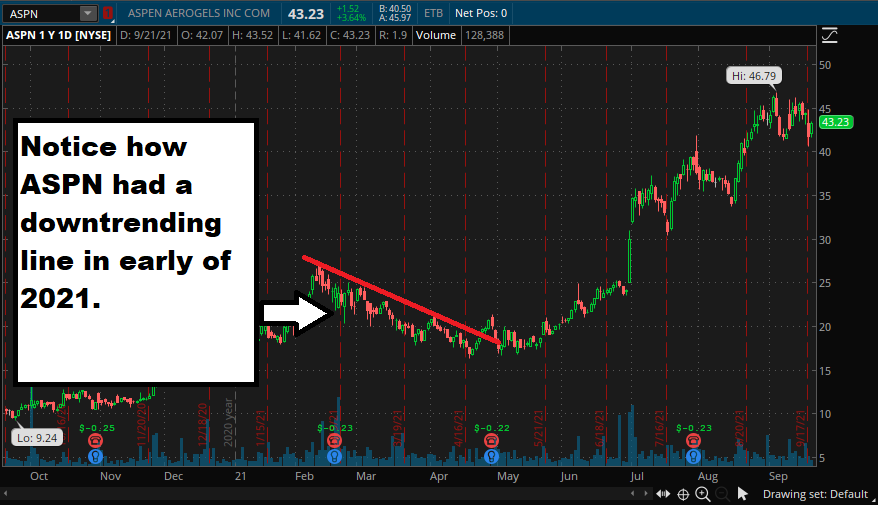
The above image is of ASPN. It was in a downwards trend and had a clear line drawn over the course of several months. If I was looking at this stock I would have placed a trade during the downtrend line to sell or add to my position once the trendline was broken.
This is because since retail day traders only trade from chart patterns you can pretty easily predict that the stock will experience more volume, thus more volatility when a trend line is broken. Which is exactly what happened to ASPN.
Charts and trendlines are good, but don’t rely upon them too much. It will blind you from what really matters, the underlying stock and statistics.
If you want to learn more about how to perform technical analysis check out this article I wrote.
Does Technical Analysis Work?
Reason 4: Failing to Read Reports

Way too often retail day traders have no idea what they are investing in. They only care what the stock is doing and if they think they can make money off it.
There is nothing wrong with this methodology, however you need to know why a stock is moving and if it’s warranted or not. This will almost certainly improve your odds of making money in the market.
For example, you might see a BioTech company who announced they cured cancer by injecting patients with baby powder and they expect their upcoming earnings report to smash market expectations. Retail investors don’t care about this news, they only care that the stock is pumping off news.
However if you read through the report you might notice that the company has not returned a single profitable quarter. Further, they have in the past released misleading information to liquidate company shares into market hype to generate a little extra cash.
Since you read the report you know that this is more than likely just a publicity stunt. Armed with this information you short the company and return 40-50% in a couple of days. The day traders lost, and you gained a ton of extra cash. Good job!
Being serious, read these reports before you invest. Read everything you can. The more you read the better you will be at investing. So many retail day traders don’t take the time to read what’s going on with their potential investment and lose nearly everything when the stock crashes.
It’s a simple way to generate more money.
Reason 5: Following Other Traders Advice
Oh boy…this is a controversial one. Following stock guru’s is a sure fire way to start losing money day trading.
I am sure you have encountered them, professional stock ‘gurus’ who display their wealth and lifestyle. They drive nice cars, have nice clothes, and have everything you could ever want. The good news is that by subscribing to their premium channel you will have this lifestyle as well….

These stock gurus are fake. They make commissions off referring traders to brokers and getting into investments and dumping it on their followers. The best way to determine if a professional trader/investor is legit is looking at how they get their revenue?
Mine? I make my money through display ads and my own investments. No smoke and mirrors here, just cold hard investments.
All joking aside, don’t fall for these stock guru’s. If you listen to them then chances are you will lose out on money. You need to learn how to evaluate trades/stocks for yourself. I promise it’s not hard to do and that once you get the hang of it you will constantly know how to generate wealth.
Investing is like riding a bike, you’re going to fall down but get back on and keep going. I will be here as your training wheels to help you until you can stand on your own. Just remember to pay little old Chronohistoria a visit once you’re a trillionaire. (Maybe stop by on the holidays)
Do not follow stock gurus. If they are good investors then their stock research/picks will stand on their own and they won’t leave their subscribers out to dry as they dump their shares onto them.
Conclusion
There you have it, the 5 main reasons day traders constantly fail. Trading/investing is a hard skill to learn but a highly rewarding one once you know what you’re doing. One of the best ways to learn is by knowing how other people fail at doing what you are trying to do. By knowing the 5 main reasons why day traders fail, chances are you will be better armed to succeed in this highly demanding field.
As always if you like content like this then feel free to subscribe to the free newsletter. I never spam and it will keep you up to date on all things stocks. Who knows maybe a little time reading might make you some quick cash, or save you some.
Further, you can check out some of the other articles below!
-
How Long Does a Short Squeeze Last? (3 Answers)
What is the time frame for you short squeeze? Well here is everything you will ever need to know to determine how long it will last.
-
Why You Still Own a Stock After It’s Delisted and How to Sell It
Do you still own a stock after its delisted? How do you sell it? Don’t worry the stock is still worth money and here is how to sell.
-
Can You Make 1% A Day in the Stock Market? (3 Steps)
Making 1% a day in the stock market is hard but defiantly doable. Here are 3 simple steps to helping you achieve this return.
Until next time, I wish you the best of luck in your investing journey.
Sincerely,

