

Over the past 10 years technical analysis has become a favorite among novice retail traders. A majority of new traders in the market attempt to predict short term stock movements in the market by looking at trend lines, chart patterns, and predictable patterns. However, more often than not retail traders end up losing money over the long run and give up.
So does technical analysis work? Here is the short and simple answer.
Yes, technical analysis does work. However, professional technical analysis is not looking at chart patterns alone but rather how the statistics of the stock itself impact underlying price movements. If you only focus on chart patterns you only see half the picture and increase your overall position risk.
While charts and trendlines do matter for technical analysis, it is the underlying statistics of a stock that matter far more. Some of the most important stock statistics are the following.
- Chart trends
- Average daily volume
- Float and short percentage
- P/E and EPS
Understanding how to interpret these statistics is vital to understanding how a stock could perform in the near term. This is great for timing and placing both entrances and exits in a stock position.
For example, if a stock has a low float but a high short percentage then that stock has a considerably higher chance of exploding from a short squeeze. Since you would understand the stock statistics of volume, float, and short percentage you could place an investment right before the stock would explode.
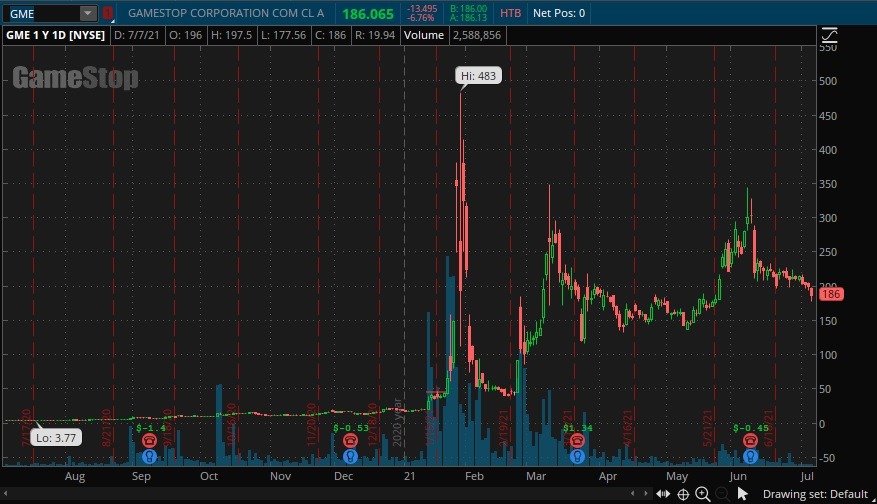
The above image is of the now famous GameStop short squeeze that happened in January of 2021. In a matter of two weeks the price of GameStop went from $45 to an insane $483, or a 1,065% increase! Imagine getting in before that happened.
I am going to show you how to evaluate the technicals of a stock to determine the near term trajectory of the potential investment. We are going to evaluate chart trend lines, daily average volume, short percentage, float, P/E, and EPS.
If you like content like this then feel free to subscribe to the free newsletter. Here at ChronoHistoria I help others generate wealth in the market by putting out stock research articles and helpful tips/tricks on the trade.
Without further ado, let’s begin.

Chart Trends
Chart trends or ‘charting’ is a tried and true methodology to place opening positions properly, not investing for significant periods of time. There are some merits to trend lines that have held up over the years.
That being said, a majority of new investors think that by drawing on charts you can effectively predict upcoming stock movements. This is simply not the case for a majority of investments.
The reason why is because of liquidity and retail traders. If a stock has a low liquidity (average volume) and a high number of novice retail traders then you can expect the retail traders to buy and sell on popular trendlines. This results in a self fulfilling prophecy where the stock will move up or down because there are enough people who see a trend forming.
Still, if you find yourself watching a potential investment that has massive retail investor attention then you can use some trendlines to adequately predict entrance and exit points.
Remember that chart patterns only work if other people are looking at the same patterns. If there is no volume or retail trader support then chances are you are going to waste time and money.
Here are some of the most iconic trendlines. All of this data comes from one of the best books on technical analysis; Technical Analysis of the Financial Markets: A Comprehensive Guide to Trading Methods and Applications by John J. Murphy (1999)
Rising Support Line
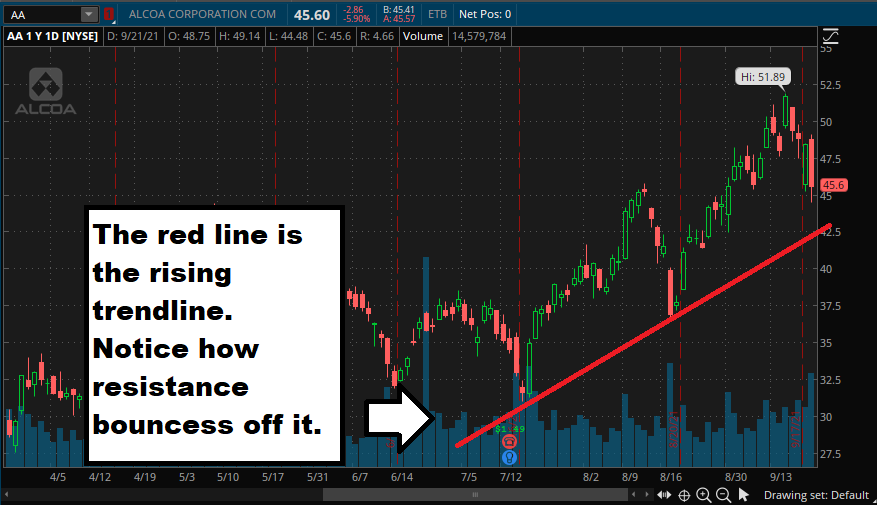
The above image is of stock AA. The rising trend line is characterized by at least two pullbacks to a range where a line can be drawn between them, as indicated by the red line. This line, in theory, is the resistance line that future stock prices should ‘bounce off.’
Essentially retail traders will buy a stock once it reaches the bottom part of a trend line. This is because retail traders have been taught to do so, and if enough people buy at the ‘resistance’ line then the stock will artificially be pumped.
In fast moving companies such as AA (Alcoa Corporation) that have retail investor’s trading their stock these resistance lines will hold so long as there is no massive change in volume.
Broken Rising Trend Line
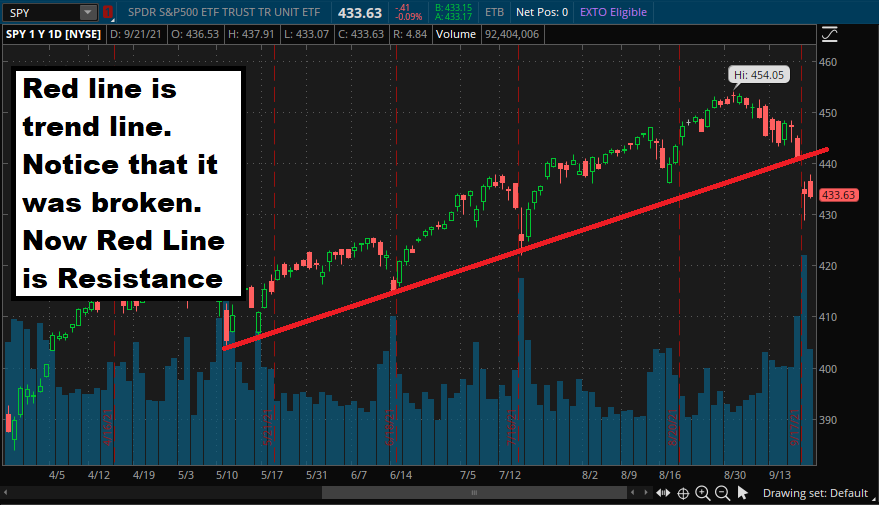
The above image is of the SPY pullback in September of 2021. Notice how the SPY bounced off the red line nearly three times over the span of four months.
However once a trend line has been broken the old trend line is now the line of resistance. If SPY should push above the trend line over the next couple weeks then the line will go back to its normal trajectory. In the above image that would mean that SPY would bounce around the $443-$445 mark.
The reason why this works is because the SPY has a massive amount of retail traders who will artificially pump the stock to match the trendlines. Thus we have a self fulfilling prophecy.
If the SPY continues to downtrend then a new line will form. This is called the downtrend line.
Downtrend Line
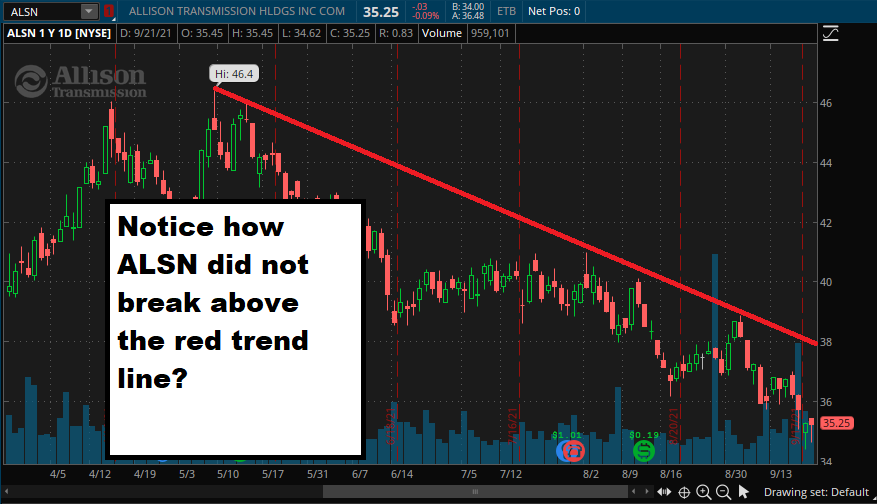
The above image is of ALSN and its recent downtrend. Notice how on three separate occasions the bulls bounced off the downtrend line? This indicates a large amount of retail traders selling and buying the stocks in accordance with the trendline.
The stock will continue to downtrend until the stock can breakout above the trend line. This could take a couple months or a couple years.
If you notice a trend like this then you can start to think about shorting or options to profit from its continued downfall.
Breaking Out from Down Trend
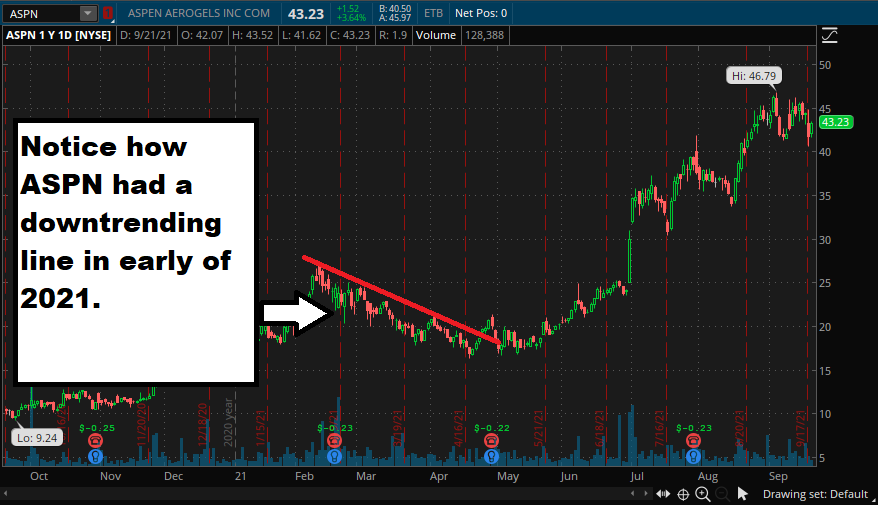
The above image is of ASPN. In early 2021 ASPN was stuck in a down trend and bounced off its resistance line several times. However in May of 2021 ASPN broke above its trend line and started to trade upwards.
Now almost 6 months later ASPN has gained over 100% and has made some people filthy rich. I wrote an article on ASPN in early July on how it was going to explode. You can check it out by clicking here.
Whenever you see a break in a downtrend line typically that indicates that either the stock hit their EPS (will go over below) or that something changed in their fundamentals to start upwards momentum.
Technical Analysis Statistic 1: Average Daily Stock Volume

The average daily stock volume is a key characteristic of technical analysis. This is because of two major reasons; First, liquidity. Second, the stock’s ability to increase/decrease in price.
Understanding how volume impacts the movement of the stock is one of the most important things you can learn about technical analysis.
Think about this. If a stock has no volume, meaning nobody wants to buy or sell the stock, then it can’t increase in price. Likewise if a stock has an insanely high volume then chances are it can move extremely fast, either up in price or down.
Professional research analysts called this implied volatility, or how volatile a stock can be under the right conditions. If you want to get good at technical analysis you need to understand the mechanics behind how volume impacts the stock.
Liquidity to Volume
A key variable to watch out for when judging a potential investment is liquidity, or the ability for an investment to be liquidated back into cash at a moment’s notice.
For an example of how important liquidity is here is the example of a random penny stock; ASNB.
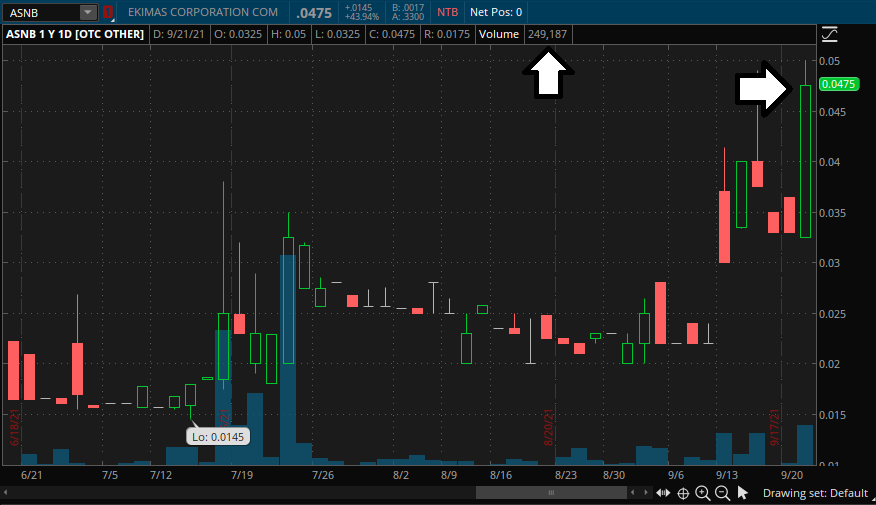
ASNB is a penny stock that is currently trading at a share value of $0.0475. The daily volume on ASNB is 249,000 shares.
This means that in total, the amount of money going in and out of this stock on a daily basis is only $11,000….
That means that if you bought $15,000 worth of shares of ASNB (don’t) then you would have to wait a whole day to liquidate your position at the current value.
Now what happens if your position starts declining in value and you want out? You can sell at a market price because you will tank the total price on the stock because you own all of the daily volume.
Too many novice investors buy into a stock with almost zero liquidity potential. Then they can’t sell their shares and are forced to hold on to them.
Always look for liquidity, the chart patterns don’t matter if you can’t sell back your investment.
Total Volume Has the Ability to Swing the Stock
It’s the law of supply and demand.
If there are a million people all with $1,000 all trying to buy the same stock at the same time then the price of the stock will shoot through the roof. This is the power of volume.
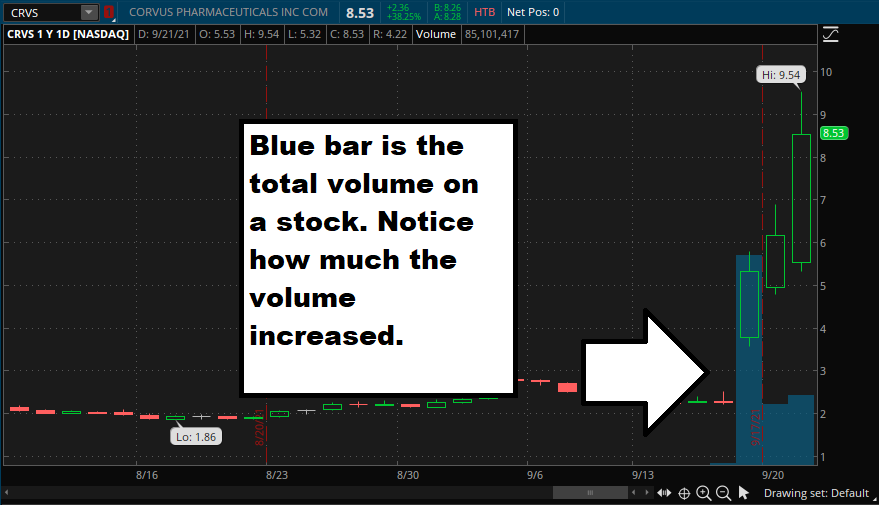
Far more important than the chart on a potential stock is the historic average volume. For the above stock (CRVS) the normal volume was around 150,000 shares per day. In late August of 2021 CRVS shot straight up on a volume increase from 150,000 shares per day to 241 million shares per day!
Always pay attention to the average volume on a stock. If you position yourself on rising volume then who knows you might be able to catch one of these crazy swings ahead of time. Generally rising volume is more important than rising price as it allows more trader/investor accounts to get into the investment. Which increases overall stability.
Technical Analysis Statistic 2: Float and Short Percentage

What do retail traders/investors and pie have in common? There is only so much of a good thing to go around.
There are only so many shares available to the public to buy and sell amongst themselves. These shares ‘float’ between different accounts. You might own 5 shares of AAPL one day and sell them to another account who now has the 5 shares.
The total amount of shares available for people to buy or sell is called the float.
If a potential stock has a low float then chances are they are extremely volatile and any amount of volume could shift the stock price either upwards or downwards. On the other hand if a stock has a high float then their price will be more stable and less prone to swings.
This is important. If you know how volatile your stock is then you can determine the chances of the stock shooting up or down. This alone is more important than any chart pattern or drawing.
To add to this volatility is something called the short percentage. This is the percentage of float (total amount of public shares) that are currently out on loan in a short position. Someone who shorts a stock eventually has to buy back the shares.
This only adds to the volatility of a potential stock. If it has a low float and a high short then the stock is at risk of a potential short squeeze. Several people have become millionaires off short squeezes. So these two variables are worth paying attention to.
How to Find Float and Short Percentage?
There are several websites that publicly release SEC info on the float/short of a stock. I might be dating myself a bit but my favorite website to easily find out the float and short percentage is Yahoo Finance.
Simply enter your stock ticker at the top and navigate to the statistics tab to find everything you need to know.
A good rule of thumb for a small float would be any company with a float size under 100 million. For the short percentage, any company with a short percentage above 12% is at risk of a short squeeze. Of course the higher that short squeeze number goes up the higher the potential stock price can go.
Technical Analysis Statistic 3: Price to Earnings and Earnings Per Share

Price to Earnings (P/E) and Earnings Per Share (EPS) are ways for a potential investor/trader to figure out what the current market sentiment surrounding a potential investment is.
Does the market think the stock is currently overvalued or undervalued? Is the market ignoring this company and is it failing? If you want an efficient way to determine the answer to these questions you first start with P/E and EPS.
EPS and P/E will not completely tell you the answers, but they will give you a good idea of where to look to find them. Nearly all of the investors/traders you meet who are ‘technical analysts’ don’t know about these metrics.
Because of that, just by knowing this you are a leg up. Congratulations!
Price to Earnings (P/E)
Price to Earnings can be best described as what a normal investor is willing to pay to acquire one share of the target company based on its past and expected future earnings.
For example large tech companies have a massive P/E because investors are confident that the company will continue to generate higher than expected returns based on historical data.
This causes the stock price to rise above what it would normally be priced at because investors are confident that the stock price will ‘keep up’ with the market.
Not all high P/E’s mean a stock is expected to rise however. A high P/E could mean that a company simply has started to enter into a period of growth. That does not mean that the company will be successful.
Earnings Per Share (EPS)
EPS is simply a publicly traded company’s profit divided by its public shares. EPS gives a theoretical ‘floor’ for the company to be valued at.
For example if a company only made $10,000 that year and had 100 shares then in theory each share at minimum would be worth $100. If the shares ever fell under this value in price then you could liquidate the entire company for more money then the market has it currently valued at.
That’s in a perfect world. In most scenarios where a company has a negative EPS there is something significantly wrong with the company and it should be avoided. No matter what the chart’s trend lines dictate you should do.
However, if a company has a high EPS then it’s considered more profitable then it should be. In a perfect world EPS would be the exact same as stock price, however that is never the case.
ESP shows you the potential ‘floor’ that a stock should have. If you see this floor rising then chances are its a good investment.
Conclusion
Technical analysis does in fact work. However if you only focus on the chart and the trend lines of it then you will be at a significant disadvantage over the long run.
You need to take into consideration everything about the statistics of the stock. Professional technical analysts will be able to take everything into account when making potential investments. Because of this they often return a much larger ROI than normal.
As always if you like content like this then feel free to subscribe to the free newsletter. I’m in the business of helping others generate wealth in the stock market and I put out research articles and tips/tricks on the profession.
Further, you can check out other articles below.
-
How Long Does a Short Squeeze Last? (3 Answers)
What is the time frame for you short squeeze? Well here is everything you will ever need to know to determine how long it will last.
-
Why You Still Own a Stock After It’s Delisted and How to Sell It

Do you still own a stock after its delisted? How do you sell it? Don’t worry the stock is still worth money and here is how to sell.
-
Can You Make 1% A Day in the Stock Market? (3 Steps)

Making 1% a day in the stock market is hard but defiantly doable. Here are 3 simple steps to helping you achieve this return.
Until we meet again, I wish you the best of luck in your investments.
Sincerely,
